Back
Trading Courses
Market Structure Explained: How to Identify the Market's True Trend Like a Professional
Learn Market Structure step by step, understand the market's overall trend, the difference between BoS and ChoCH, and how to identify the best entry zones while avoiding trades against the trend.
2026-06-28
A lot of people, as soon as the market starts dropping, will say:
* "This is a buying opportunity.
* "I'll just DCA.
* "I'm a long-term investor.
* "My targets are much higher.
There's nothing inherently wrong with any of that...
The mistake is buying without knowing whether you're buying with the market or against it.
And that's the difference between someone who accumulates professionally...
...and someone who's simply increasing their losses while thinking they're investing.
Accumulation has a method.
DCA has a strategy.
There's no such thing as blindly buying every time the price drops.
The first thing you need to look at... is the trend.
One of the very first lessons almost everyone learns in trading is:
Dow Theory
Market Trends
The Trend Is Your Friend
So, if you've already learned that the trend is the most important factor...
Why would you buy in a downtrend as if the trend doesn't even exist?
This is one of the biggest mistakes I see over and over again.
Many people believe they're accumulating...
when in reality, they're simply buying against the market.
So, should I wait for the trend to turn bullish and then buy at the highs?
This is the question that comes up all the time:
So, should I wait until the market goes up and then enter late?
No, my friend...
The point isn't to wait until price has already taken off.
The point is to understand how the market moves.
And once you understand Market Structure, you'll be able to tell the difference between:
A real bottom
And a bottom that everyone thinks is the bottom
And that's a huge difference.
What Is Market Structure?
Simply put...
Market Structure is the way the market moves.
It helps you identify:
* Whether the market is bullish or bearish.
* Where the true trend is.
* Whether you're looking at just a pullback...
* Or the beginning of a reversal.
* And whether the area you're looking at is actually worth buying.
Once you truly understand Market Structure,
you'll start making decisions based on logic—not emotions.
Follow these steps in order, and you'll know where to buy correctly.
1. Always Start with the Higher Timeframe
This is one of the biggest differences between a beginner and a professional.
The higher timeframes tell the real story.
The weekly and daily charts should be the primary reference for any analysis.
They tell you:
* Is the market in an uptrend?
* Or a downtrend?
* Is it in an accumulation phase?
* Or has distribution begun?
Only after that should you move down to the lower timeframes to look for trading opportunities.
But if you start with a lower timeframe while ignoring the higher one...
You'll probably find plenty of setups that look great...
but most of them will be against the true trend.
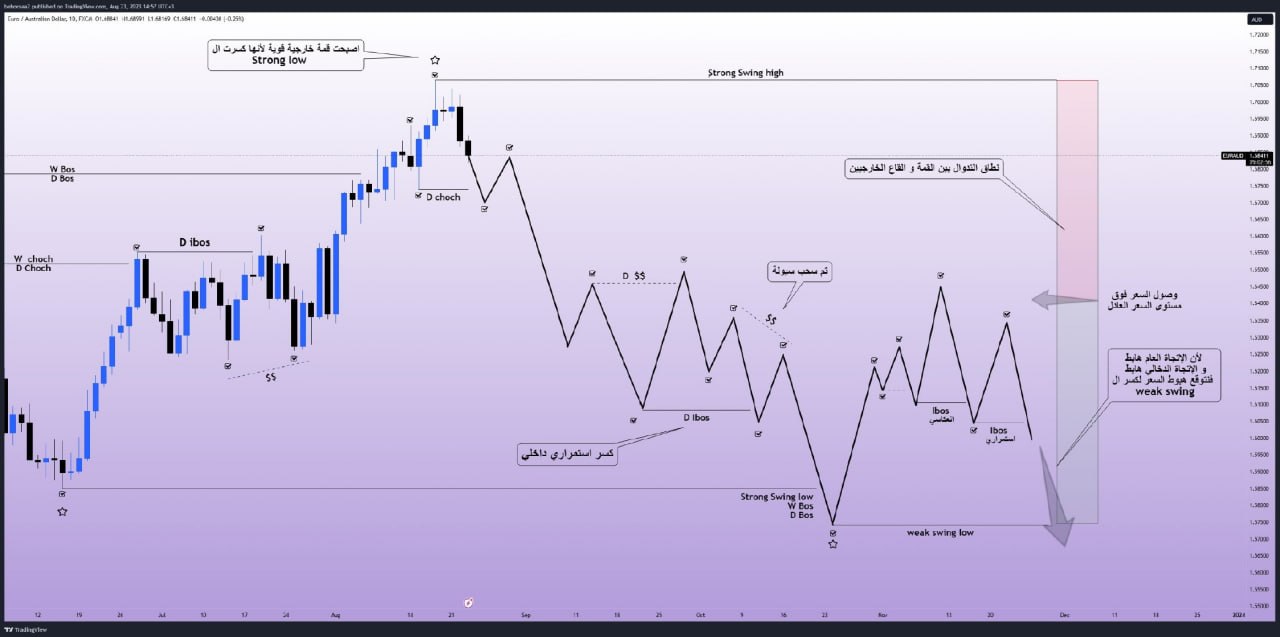
2. Not Every High Is Resistance... and Not Every Low Is Support
This is one of the most common mistakes.
Not every high or low on the chart represents a strong level.
A strong high or low is backed by valid reasons, such as:
* A clear overall trend.
* A genuine market structure break.
* Liquidity being taken before the move.
On the other hand, any weak swing...
can be broken by the market maker with ease.
That's why randomly drawing highs and lows leads to random trading decisions.
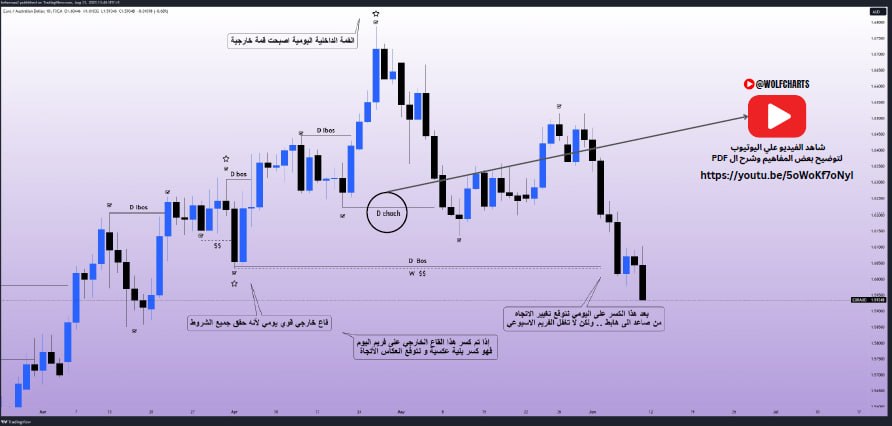
3. Understand the Difference Between BoS and ChoCH
A lot of traders see any break and immediately assume the market has reversed.
That's not correct.
BoS (Break of Structure)
A break in the market structure that signals either trend continuation or trend confirmation.
ChoCH (Change of Character)
The first sign that the internal trend may be starting to change.
The problem is that many traders confuse the two...
As a result, they either enter too early or too late.
Understanding the difference between them can save you from many trades that would have been entered at the wrong location.
We've explained the difference between them in detail in our free educational course on our YouTube channel and website.
4. Watch Out for Fakeouts (Using Multi-Timeframe Analysis to Identify Deception Zones)**
The market loves to deceive the majority.
You might see what looks like a very clear break of structure on the 1-hour timeframe and assume the trend has reversed.
Meanwhile, the daily timeframe is still holding its primary trend.
This is what we call a fakeout.
Its purpose is often to:
* Collect liquidity.
* Stop traders out of their positions.
* Then allow the market to continue in its original direction.
That's why every signal on a lower timeframe should always be viewed within the context of the higher timeframe.
5. Understand the Difference Between the Internal Trend and the External Trend
This is another point that many traders overlook.
You might see the 4-hour timeframe in an uptrend...
while the daily timeframe is still in a downtrend.
That means you're trading a pullback...
not the primary trend.
As a result:
* Your probability of success is lower.
* Your risk is higher.
The more the internal trend and the external trend align...
the stronger your trade setup becomes.
When Does DCA Actually Make Sense?
DCA isn't simply about buying every dip.
The right way to do it is to have clear reasons for adding to your position, such as:
* The overall trend is clear.
* Price has reached a strong zone.
* You have confirmation from Market Structure.
* Your risk is properly calculated.
* You know exactly when you'll stop buying if the scenario is invalidated.
Buying just because the price is cheaper than it was yesterday...
That's not DCA.
That's hope.
Still Feel Like Market Structure Is Complicated?
No worries—that's completely normal in the beginning.
Market Structure is one of the most important concepts in trading, but it's also one of the most overcomplicated.
That's exactly why I created a completely free Smart Money Concepts (SMC) series, explained in a simple, practical way—without unnecessary complexity or confusing terminology.
In this series, you'll learn:
* How to identify the market's true trend.
* The difference between BoS and ChoCH.
* How to understand liquidity and identify high-probability entry zones.
* How to read Market Structure step by step.
* Real-world analysis using live chart examples.
Start with the Free Course.
If you're new to trading, I recommend starting with this video first.
📲 To get free daily market analysis and educational content, join our Telegram group:
You'll be surprised by how much clearer the market becomes... and how much calmer, smarter, and closer your trading decisions will be to the way the Smart Money thinks. 🔥
Bebo | Financial Markets Analyst
A financial markets analyst and trader with over 7 years of experience, offering a specialized educational approach through a comprehensive 3-level course designed to master SMC concepts. He has also developed his own methodology based on new practical concepts that improve entry points and build a more professional and profitable trading approach. Over 3 years, he has trained more than 600 students through free and paid educational content.