
Predicting Bitcoin Price Movement Using the AASI Indicator
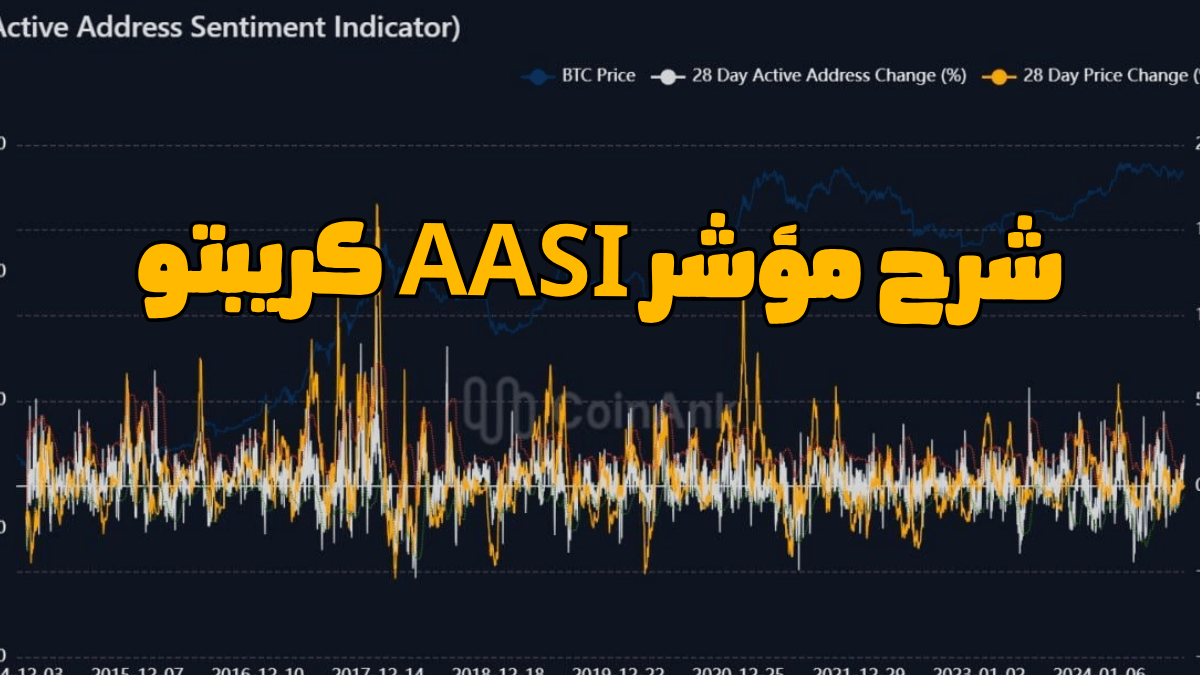
In the crypto market, not every rally means the market is strong, and not every increase in price means a coin is actually gaining value.
Sometimes, the price can skyrocket because of excitement and the fear of missing out (FOMO), without any real activity on the blockchain supporting the move.
This is where On-Chain indicators come in, trying to answer an important question:
Is Bitcoin rising because of real usage and activity on the network, or is it simply speculation with the price running on its own?
One of the most powerful indicators for understanding this relationship is the AASI indicator.
Let’s break it down in a simple way:
What is the AASI indicator?
How is it calculated?
How do we read it?
When could it signal a buying opportunity?
And when could it warn us of a bubble?
Active Address Sentiment Indicator
It’s an indicator that connects two very important things:
Bitcoin’s price movement
and
The number of active addresses on the blockchain
Simply put:
The indicator tries to determine whether a price increase is accompanied by real growth in network activity…
Or whether the price is rising faster than actual network activity.
Because ultimately, the value of a blockchain network isn’t just about its price.
It’s also about the number of users and the real activity happening on the network.
In simple terms, the formula is:
AASI = 28-day price change ÷ 28-day active address change
For example:
If Bitcoin’s price increased by 50% over 28 days,
while the number of active addresses increased by 25%,
then:
AASI = 50 ÷ 25 = 2
This means the price increased at a faster rate than network activity.
The larger the gap between price movement and real network activity, the more important the AASI reading becomes.
The indicator typically moves around the zero level, but the most important thing is understanding the relationship between price and network activity.
When AASI Is Negative
When the indicator is below zero, it generally means:
Network activity is increasing,
but price hasn’t responded with the same strength.
And this is where things get interesting.
There could be real interest in the asset and increasing network usage, while the market hasn’t fully priced that activity in yet.
That can sometimes be an opportunity to consider an entry, especially when the other factors are supportive.
In other words:
The network improves before the price moves.
When AASI Is Extremely High
If the price is rising very quickly, but the number of active addresses isn’t increasing at the same pace, it may mean the price is being driven more by speculation and excitement than by real network usage.
In other words:
Price is running faster than the blockchain.
And this could be a sign of:
Overbought conditions
Strong FOMO
A price move that isn’t sufficiently supported by network activity
This doesn’t mean a decline has to happen immediately, but it does mean the risk is increasing.
When AASI Is Near Normal Levels
If the indicator is moving in a balanced way, it means that:
Price and network activity are moving together logically
This is generally a healthier market condition, because the price movement is supported by user behavior and network activity, rather than being driven purely by speculators.
The indicator isn’t designed to tell you:
“Buy now”
or:
“Sell now”
Its real strength lies in revealing inconsistencies.
1- Identifying buying opportunities during market downturns.
For example:
The price is declining, but the number of active addresses continues to increase.
Here, there could be:
Accumulation
Long-term investor entry
Continued interest in the network despite weak price action
And this means you should study the area more deeply instead of judging it based on price alone.
2- Identifying dangerous market tops
If you see:
Price rising very aggressively,
but network activity isn’t increasing at the same rate.
You need to ask:
Is the rally real?
Or is it just a temporary wave of excitement?
Because some of the strongest crashes begin when price becomes disconnected from reality.
3- Understanding Market Volatility Phases
If the indicator is moving within a normal range without extreme readings, it suggests that the market is moving in a balanced way.
Here, it can be used alongside other tools to identify the overall trend rather than making quick decisions.
The indicator is useful in several ways:
Determining whether a rally is genuine or just a Pump
Identifying divergences between price and user behavior
Looking for opportunities before the price moves
Reducing the impact of FOMO during strong rallies
Identifying areas where the risk of a correction increases
Combining it with other On-Chain indicators such as:
MVRV
Puell Multiple
Liquidity data and large wallet movements
Because the best analysis always comes from using a combination of tools, not relying on a single indicator
This is a very important point
On-Chain indicators are powerful, but they’re not crystal balls
It has some limitations:
Signals can take time to appear
They are not suitable for very fast trading
They can sometimes be affected by internal activity or unusual network behavior
They cannot tell you the best entry or exit point on their own
But using them alongside technical and fundamental analysis gives you a much stronger overall picture
AASI simply tries to answer an important question:
Is Bitcoin’s price moving because of real value and network activity, or is it driven mainly by speculation?
If the indicator is very low while network activity remains strong, there may be an opportunity worth studying.
If the indicator is very high and price is running without real support, it’s time to be cautious about excessive speculation
But the most important rule:
Don’t use AASI on its own. Use it as part of the bigger picture
The market doesn’t move based on a single indicator Understanding the relationship between price, users, and liquidity is what gives you a deeper view of where the market could be heading