
Dealing Range in SMC: How to Define It and When to Update It
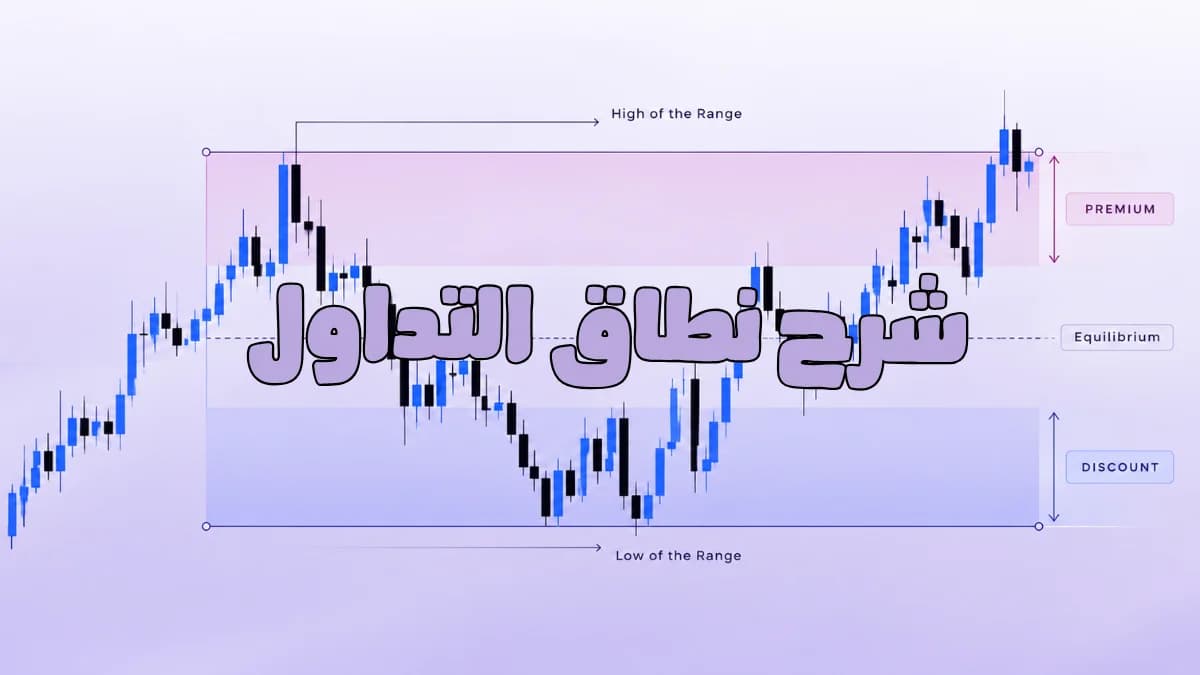
You draw your Fibonacci tool, see that price is below the 50% level, and decide it is cheap enough to buy.
Hold on. Did you choose the right high and low in the first place?
Change those two points and the 50% level changes too. The same price you consider cheap could sit above the midpoint of another range. Before discussing Premium and Discount, we need to know which move we are measuring and why we chose its boundaries.
Start with market structure
A Dealing Range is the price interval between the reference low and high used in your analysis. Price does not have to be moving sideways; a range can be defined within an uptrend or a downtrend.
In the bullish example we are following, we identify the strong low responsible for the move that broke the previous strong high, then the highest high reached by that move up to the moment we are analyzing. Those two points form the boundaries of our example.
Notice that I did not say: choose the latest small low before price rose.
There are many highs and lows inside a move. An internal low formed along the way is not necessarily the origin of the move we are measuring. If that distinction is unclear, review swing highs and lows first. An error in identifying them carries over into your range.
Look at the diagram: what are we measuring?
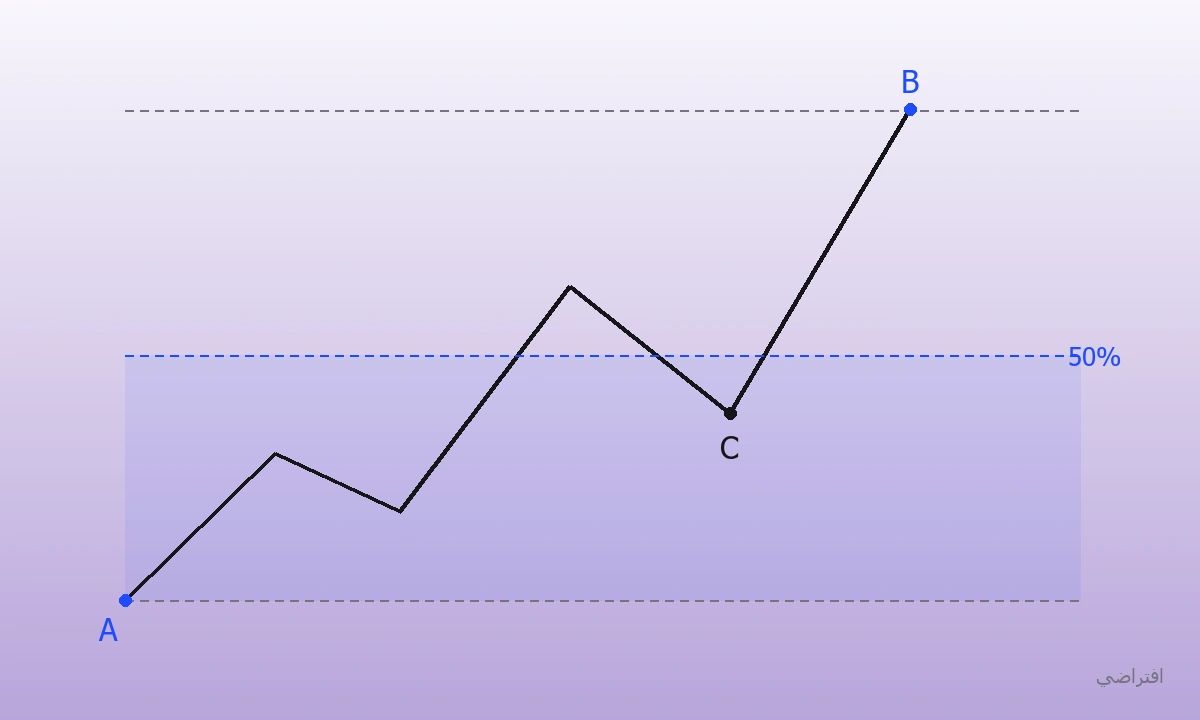
This is an illustrative diagram, not a real trade. Assume that reference low A has already been confirmed and that B is our highest high.
Our range runs from A to B. C is an internal low within the same move. Moving the starting point from A to C changes the move you are measuring. You are no longer measuring the same range.
We can study an internal range too, but we must distinguish between the two. The mistake is analyzing the larger range and then treating an internal range's midpoint as the midpoint of the entire move.
The 50% level tells you where price sits
Once the boundaries are defined, we can divide the range into two halves:
Above the midpoint: Premium, or relatively higher prices within that range.
Below the midpoint: Discount, or relatively lower prices within the same range.
“Cheap” is relative here. It means price is below the midpoint of the move you selected. It does not establish that an asset is below its intrinsic value, or that price cannot fall further.
So if price reaches Discount, do I buy?
No. So far, you have only located price. In this bullish example, you still review demand zones within the range, liquidity, and whether internal direction and the confirmation required by your setup support an entry. Being below 50% is not an entry setup by itself.
When should you update the range?
Review the boundaries when the structure behind your drawing changes. In the lesson's example, a new higher high changes the upper boundary and midpoint. As new swings form and a new strong low is established, we draw the range appropriate to the new move.
A small internal low or a minor bounce does not automatically mean you should erase the drawing and start again. Ask: Has the reference swing actually changed, or am I just looking at details within the same move?
If price breaks the reference low, do not keep using the same bullish assumption without reviewing it. Return to structure and the meaning and conditions of the break on your chosen timeframe. Do not keep widening the range just to make price appear to be in a buying area.
Define it before you see what happens next
Open an old chart and hide the upcoming price action. Identify your timeframe and reference high and low, and write down why you chose them. Then mark the midpoint and locate price relative to it.
Move the chart forward. Every time you change the boundaries, record what changed in structure. If your only reason is that the new range makes the entry you want look better, review your choice.
The goal is to know which move you are measuring. Then we can link the range to a smaller timeframe and look for confirmation without confusing an internal move with the larger structure. If the daily and hourly charts seem to point in different directions, read linking timeframes and distinguishing overall and internal trends.
Review the original application in Bebo's dealing range lesson. Pause at each example and try defining the boundaries before the explanation.