
Linking Timeframes: Why Is the Daily Bearish While the Hourly Is Bullish?

You open the daily chart and see a downtrend. On the hourly chart, price is making higher highs and higher lows. You return to the daily and feel concerned, then look at the hourly again for reassurance.
Does that mean one of the charts is wrong?
Not necessarily. The hourly rise may be an internal move within the daily downtrend. To interpret it, you need to identify the role of each timeframe and the structure that has actually changed.
Saying “the trend” is not enough
When you say the trend is bullish, specify the timeframe and whether you mean its overall trend or its internal trend.
Each timeframe can have an overall structure and internal movements. A higher timeframe does not show only an overall trend, and a lower timeframe does not show only an internal trend.
When linking timeframes, we compare the higher timeframe's structure with the lower timeframe's structure. An internal move on the higher chart can form a clear overall trend on the lower chart.
If market structure is still unclear, start with the market structure article, then return to follow the same move across two charts.
Follow the same move
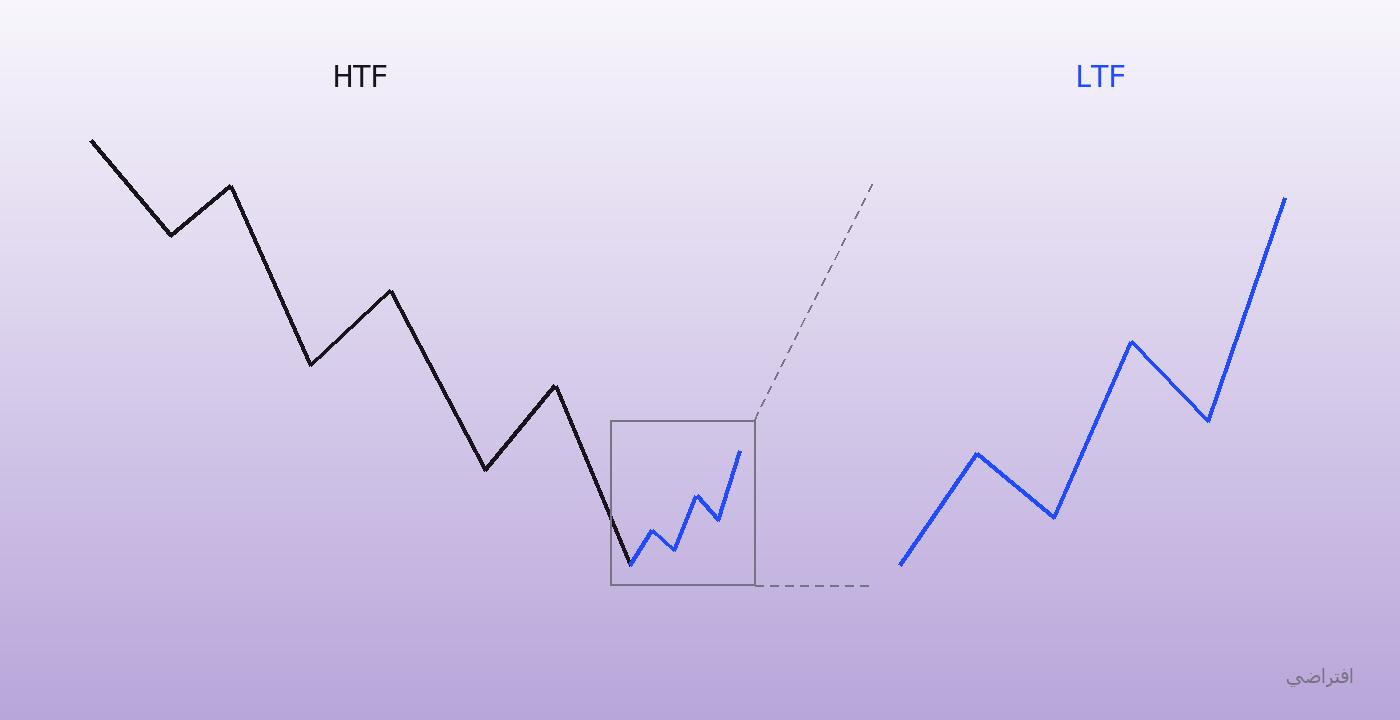
This is an illustrative diagram. On the left, the larger trend is bearish and the blue section is a rising move within it. On the right, we have enlarged that same section to show its detail; we have not added a new move.
For this example, the daily is the analysis timeframe and the hourly is the lower timeframe. This pairing is for illustration, not a fixed combination to use for every asset and trading method.
On the daily, the reference highs and lows still show an overall downtrend. An internal rising move then begins.
That move alone does not establish that the overall daily trend has reversed. It gives us something to examine on the hourly: has this rise changed the hourly chart's overall structure, or is it still only an internal move there as well?
The first break does not mean everything has changed
An hourly CHOCH may occur while the strong reference high of the bearish structure remains unbroken. In that case, the internal structure has changed, but we cannot treat it as confirmation that the overall structure has reversed.
In the lesson's example, we wait for the relevant strong high to break before treating the lower timeframe's overall trend as bullish. We then examine its internal trend: is it still bearish, or has it aligned with the bullish direction?
This is the difference between saying “I saw a break, so I bought” and identifying exactly which structure has changed and what you are still waiting for.
Linking timeframes does not require both the daily and hourly overall trends to be bullish
The overall daily trend can remain bearish while a bullish opportunity develops on the lower timeframe within the daily chart's internal rising move.
In the lesson's example, we check three things:
The higher timeframe's internal trend has turned bullish.
The lower timeframe's overall trend has been confirmed bullish.
The lower timeframe's internal trend is aligned with the bullish direction when looking for a setup.
These conditions are not an automatic instruction to buy. The demand zone, liquidity, price's position within the dealing range, entry-model conditions, and risk management still matter.
You also need to remember the scale of the move you are studying. Confirmation of an hourly rise does not prove that every daily high will break. You are examining a smaller move within a larger structure that still needs monitoring.
Before moving to a lower timeframe, write down why
Record the higher timeframe's overall and internal trends, the area price has reached, and the change you are waiting to see on the lower timeframe.
If you move to the hourly and the conditions are missing, do not keep switching to the five-minute or one-minute chart until you find a pattern you like. A signal on another timeframe does not automatically satisfy the condition missing on the hourly.
If the lower timeframe's internal trend turns against the scenario before entry, reassess the setup rather than relying on the previous structure.
Test your understanding with the same chart period
Capture the higher timeframe and the same period on the lower timeframe. Mark the same high or low in both images. Write down which structure it belongs to on each chart and what its break changes.
If you can explain that relationship, you will understand why the charts can show different directions and what you still need to wait for. Each switch between charts will answer a specific question rather than simply provide reassurance.
Review the timeframe-linking lesson and its application, and apply the steps to a chart before moving on to more examples.