Back
Smart Money Concept
What Are FVG Zones in Trading? And How Can You Use Them Correctly Instead of Letting Them Cause Losses?
Learn the concept of **FVG (Fair Value Gap)**, or market imbalance zones, and how to identify them on the chart. Discover how to use them alongside trend analysis, liquidity, and supply-and-demand zones to improve your entry and exit decisions while avoiding common trading mistakes.
2026-06-23

I know people who learned with me and were losing a lot of money because of FVGs, even though the concept itself is simple to understand.
Imbalance Zones (FVG – Fair Value Gaps)
You need to understand them clearly if you want to succeed in trading.
FVGs are not just empty gaps on a chart. They are signs of areas where liquidity is concentrated and where the market often likes to return in order to rebalance price.
Understanding them is essential if you want to learn trading and investing in crypto or the Saudi market.
FVGs are not just empty gaps on a chart. They are signs of areas where liquidity is concentrated and where the market often likes to return in order to rebalance price.
Understanding them is essential if you want to learn trading and investing in crypto or the Saudi market.
What Are FVG (Fair Value Gap) Zones?
Simply put, an FVG is a very important liquidity zone. It forms when price moves aggressively and rapidly in one direction—whether through strong buying or strong selling—without normal interaction between buyers and sellers.
As a result, a price imbalance is created, leaving behind unfilled liquidity.
The market often returns to these areas later in order to rebalance the move ⚖️.
As a result, a price imbalance is created, leaving behind unfilled liquidity.
The market often returns to these areas later in order to rebalance the move ⚖️.
▪️ So, How Does an FVG Appear on the Chart?
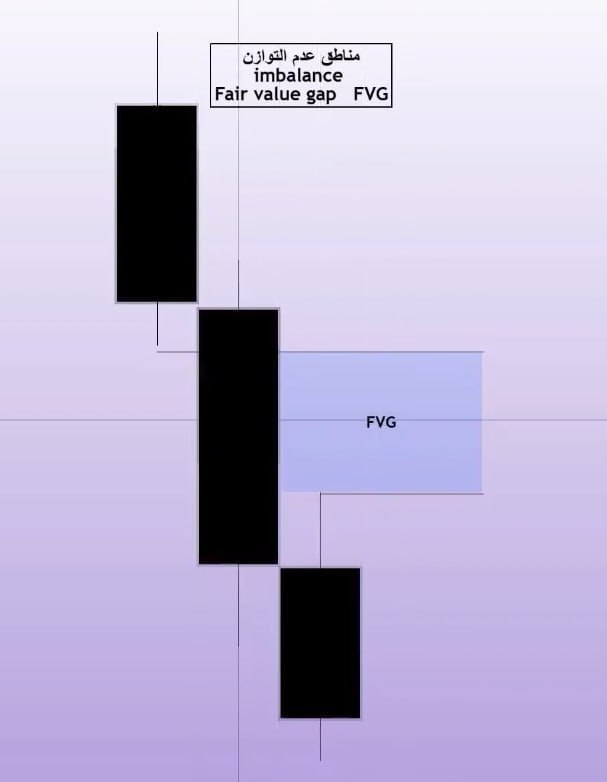
The FVG is usually formed across three candles, just like the example shown in the image. Focus on the image and you'll understand it clearly.
* A very strong bullish or bearish candle appears.
* Then another candle forms far enough away to leave a clear gap between the wicks.
* That gap is the **FVG (Fair Value Gap).
* A very strong bullish or bearish candle appears.
* Then another candle forms far enough away to leave a clear gap between the wicks.
* That gap is the **FVG (Fair Value Gap).
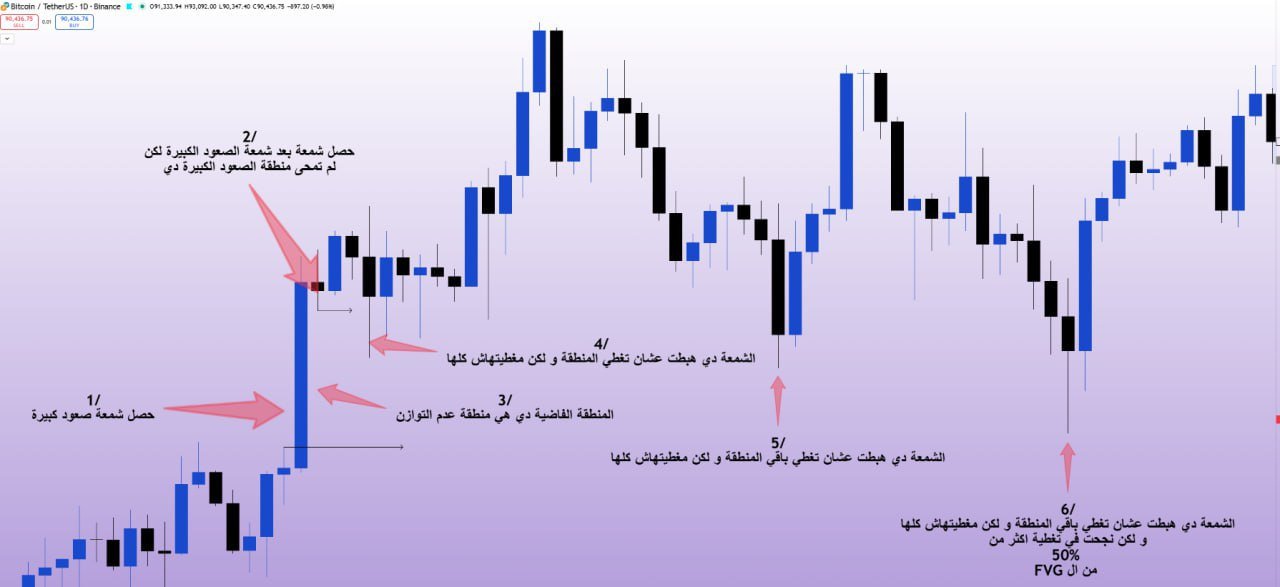
▪️ So, How Do We Identify an FVG Accurately?
🟢 Look at the wicks between candles
🟢 See where price moved up or down without a pullback
🟢 Draw the area between the last two opposite wicks
🟢 See where price moved up or down without a pullback
🟢 Draw the area between the last two opposite wicks
The topic needs practice and application on FVG locations on the chart.
In the image in front of you, the steps for identifying the FVG are clearly explained.
▪️ What is the difference between a real gap and a filled (covered) gap?
A real gap is a gap that price has not returned to yet.
A filled (covered) gap is a gap that price has already touched or passed through, and the price imbalance has been closed.
This difference is very important in determining whether the zone still has value or is already invalid. 👌
A filled (covered) gap is a gap that price has already touched or passed through, and the price imbalance has been closed.
This difference is very important in determining whether the zone still has value or is already invalid. 👌
▪️ Using FVG with Supply and Demand
▪️ The FVG is not enough on its own — its real strength comes when you combine it with:
🟠 Overall trend
🟠 Supply and demand zones
🟠 Liquidity areas
At that point, you can get a much more professional and high-probability entry 🔥
And of course, I will explain all of this to you for free… follow the articles on the website.
❗️Now, what are the common mistakes I made at the beginning—and that most people are still making today?
⏺️ Relying on FVG alone
⏺️ Entering as soon as price touches it
⏺️ Ignoring the overall and internal trend
The zone is powerful… but it’s not magic. You must connect it with the bigger picture.
Personal advice from me, as bebo
Before any trade, ask yourself:
“Is there a nearby FVG zone? And has the market already returned to it or not?”
This question alone is enough to change the way you analyze the market by 180 degrees.
“Is there a nearby FVG zone? And has the market already returned to it or not?”
This question alone is enough to change the way you analyze the market by 180 degrees.
If you didn’t fully understand the explanation, you can watch a video as part of the SMC series I teach professionally and completely for free 👌
Also, there is daily free follow-up on the Telegram group — same style, same calm approach, and same focus on helping you truly understand the market.
Also, there is daily free follow-up on the Telegram group — same style, same calm approach, and same focus on helping you truly understand the market.
📌 Join the group and watch the videos from here, and follow along with me personally.
Watch the course for free from this link.
And if you are a beginner, start by watching this video.
It will help you a lot connect the concepts together and improve your analysis in a clear and strong way 🔥
Bebo | Financial Markets Analyst
A financial markets analyst and trader with over 7 years of experience, offering a specialized educational approach through a comprehensive 3-level course designed to master SMC concepts. He has also developed his own methodology based on new practical concepts that improve entry points and build a more professional and profitable trading approach. Over 3 years, he has trained more than 600 students through free and paid educational content.