
How to Track Traders and Whales Movements on Hyperliquid
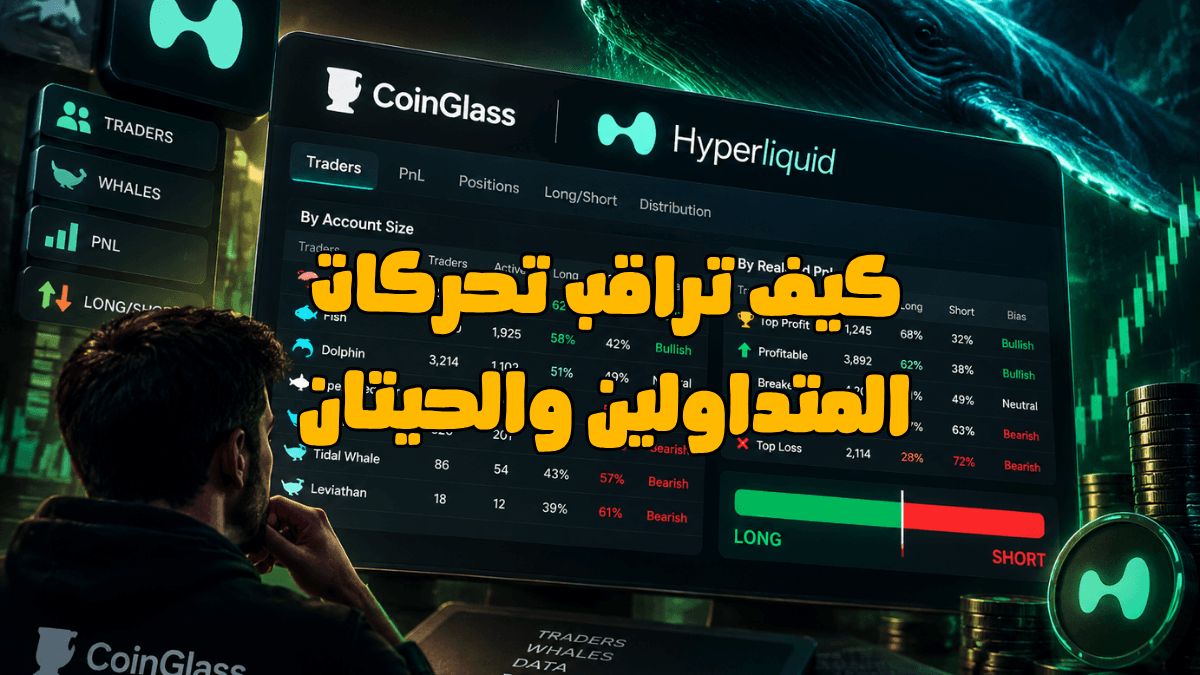
**CoinGlass’s New Hyperliquid Monitoring Tool: See Who’s Winning and Who Controls the Market**
In trading, the problem isn’t just knowing whether the price is going up or down…
**The real problem is knowing who is moving the market.**
**Is the move coming from retail traders?**
**Or are whales entering aggressively?**
**Or have smart wallets that consistently generate profits started moving?**
This is where data analysis tools become important, and one of the most useful new tools that can help you understand the bigger picture is CoinGlass’s tool for Hyperliquid.
This tool gives you a direct look at wallet distribution and current position directions, allowing you to see the market from a different perspective instead of relying only on the chart and price.
**What Does CoinGlass’s Hyperliquid Tool Offer?**
**The tool helps you track:**
* Current trader positioning
* Large wallet movements
* The percentage of wallets holding long and short positions
* The groups dominating the market
* Whether most traders are bullish or bearish
In other words, instead of only seeing the price, you start seeing **the behavior of the people behind the price.**
**The First Breakdown: Analyzing Wallets by Capital Size**
The first way to classify wallets inside the tool is based on account size.
Each row represents a specific category of traders based on the amount of money held in their wallets.
The categories are divided into:
🦐 **Shrimp**
Very small wallets.
🐟 **Fish**
Traders with small accounts, but larger than the previous category.
🐬 **Dolphin**
Medium-sized wallets.
🦈 **Apex Predator**
Large wallets with greater potential influence on the market.
🐋 **Whale / Tidal Whale / Leviathan**
Different whale levels based on capital size.
**What Can You Learn From This Breakdown?**
The idea isn’t just to know the size of the wallet…
The more important question is:
What are these wallets doing?
The tool shows you:
* The number of wallets in each category
* The number of wallets with open positions
* Whether most of these wallets are long or short
* Whether the overall direction of the group is Bullish or Bearish
For example:
If you find that most large wallets are holding long positions, this gives you an idea of where this group is positioned.
And if you find that only retail traders are holding longs while large wallets are moving in the opposite direction, that’s something you need to pay more attention to.
The More Important Breakdown: Wallets by Actual Performance (PNL)
This is the part I find more interesting about the tool, because wallet size alone doesn’t mean the owner knows what they’re doing.
You might find a huge wallet going through a losing period.
At the same time, you might find a smaller wallet that has been consistently profitable.
That’s why the tool classifies wallets based on:
📈 The highest-profit wallets
📉 The wallets experiencing the largest losses
**It also shows the current direction of each group:**
Are profitable traders entering longs?
Or have they started betting on the downside?
**Why Is Analyzing Profitable Wallets More Important Than Just Tracking Whales?**
Here’s the important point…
A lot of traders focus only on whales, but having a large amount of capital doesn’t always mean having a smart decision-making process.
A whale can enter a bad trade and lose.
But a trader who consistently generates profits can give you stronger information about how experienced traders are thinking.
That’s why tracking profitable wallets can be more useful than simply tracking the largest wallets by size.
**How Do You Use the Tool Practically?**
**Don’t use the data on its own. It’s better to combine it with:**
✅ Price direction
✅ Support and resistance zones
✅ Trading volume
✅ Large wallet movements
✅ Performance of profitable wallets
For example:
If the price is at an important area and profitable wallets start increasing their positions in a specific direction, this gives you a clearer picture of the potential continuation of the move.
But don’t treat the tool as a direct entry signal.
It’s a tool that helps you understand market behavior, not a replacement for analysis and risk management.
Conclusion
The market doesn’t move because of the chart alone…
The market moves because of the decisions of people entering and exiting with their money.
Tools like CoinGlass help you see part of this picture:
Who is entering?
Who is exiting?
Who is making money?
And who is betting on the wrong direction?
The better you understand trader behavior, the more your decisions can be based on data rather than simply making predictions.