
Volume vs Open Interest: Why Trading Activity and OI Differ

You see high trading volume in a crypto contract, but open interest is almost unchanged. Are the data contradictory?
No. Volume counts what traded during a period; open interest counts contracts that remain open. A contract can change hands without increasing the total number of open contracts, and it can trade repeatedly during the same period.
Let’s use a small example instead of memorizing a rule that says, “The number rose, so the price must rise.”
Compare the same market and the same units first
We are discussing volume and OI for a derivatives contract, not comparing spot volume with derivatives positions. Choose the same market and data source, define the period for measuring volume, and compare OI at the beginning and end of that period.
Check the display units too. The number of contracts is different from their dollar value. If OI is shown in dollars, a price change can change that value even when the contract count has not moved by the same percentage.
Every contract has a buyer and a seller. OI counts the contract once, not once for each side. An increase in open contracts therefore does not mean there are more buyers than sellers.
Example: 17 contracts traded, but only seven remain open
The numbers are hypothetical. All stages occur within the same volume-measurement period, using the same contract specifications and assuming no other positions.
Stage A: New participants open ten contracts against other new participants. Cumulative volume becomes ten, and open interest becomes ten.
Stage B: Holders of four long positions sell them to new buyers, while the holders of the corresponding short positions remain in place. Four more contracts trade, but positions change hands; volume becomes 14 and OI stays at ten.
Stage C: Holders of three long positions close against holders of short positions who are also closing. Volume increases by three, while those contracts leave the outstanding total; volume becomes 17 and OI becomes seven.
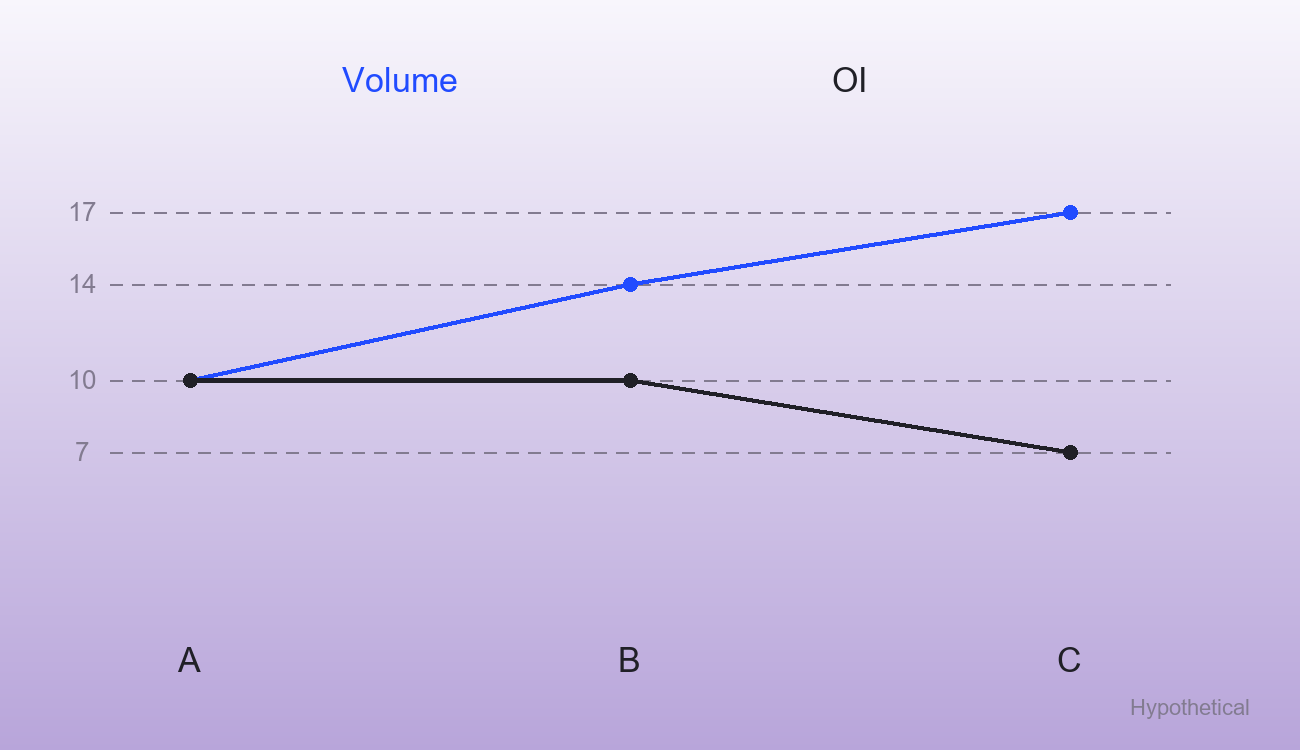
There is no contradiction. Trading was active, but trading activity is not the same thing as growth in the positions left open in the market.
What does an increase tell you about direction?
If OI rises, you see an increase in open contracts in the chosen measurement units. If it falls, the outstanding total falls. The number alone does not identify which side initiated execution or guarantee the next price move.
If volume rises while the price falls, do not automatically conclude that a reversal has arrived or that all the activity was “selling only.” Every execution has a buyer and a seller. Additional data can help you understand execution and context.
This complements using volume alongside chart analysis: volume needs to be connected to price action, rather than treated as an independent entry button.
When can CVD help?
If your question is whether aggressive buying or selling dominated execution, CVD can add information. It tracks the cumulative difference between taker buy and taker sell volume in the selected data.
Even that reading does not reveal every position detail. An aggressive buy in a derivatives market may open a position or close a short. Combining data helps you form an interpretation; it is not an account statement for every participant.
The related tools are covered in the CoinGlass Legend guide, particularly the distinction between actual execution and resting orders.
An exercise before memorizing directional tables
In the previous example, what happens if five additional contracts trade entirely through transfers from existing long holders to new buyers, while the short holders stay in place?
Volume for the period becomes 22, and OI stays at seven. If you can explain why, you understand the core difference.
When you next open the data, start with three questions: am I measuring activity during a period or contracts still open? What are the units? Which market or exchanges are covered? Without those answers, you can compare correct numbers and still reach the wrong conclusion.